I decided to read it because at the time of reading I had to draw a lot statistical graphs at my work and I had no idea how to do it in a best possible way. I’ve read it and convinced myself even more about facts I already knew:
- Piecharts are worthless and misleading.
- You need to note everything on your graph, especially axes.
- Your graphs shouldn’t be too smart.
The book has two main ideas. It’s graphical integrity and data-ink ratio. They could be described in 10 pages or so (including good and bad examples), but the author missed his own points in writing. The writing is verbose (i.e. data-ink ratio is low), most of the examples are of questionable use.
I guess it’s pretty long because Tufte wanted to cover a little bit of history of graphical representation of an information.
Graphical integrity
Graphical integrity is more likely to result if these six principles are followed:
- The representation of numbers, as physically measured on the surface of the graphic itself, should be directly proportional to the numerical quantities represented.
- Clear, detailed, and thorough labeling should be used to defeat graphical distortion and ambiguity. Write out explanations of the data on the graphic itsel£ Label important events in the data.
- Show data variation, not design variation.
- In time-series displays of money, deflated and standardized units of monetary measurement are nearly always better than nominal units.
- The number of information-carrying (variable) dimensions depicted should not exceed the number of dimensions in the data.
- Graphics must not quote data out of context.
Data-ink
Five principles in the theory of data graphics produce substantial changes in graphical design. The principles apply to many graphics and yield a series of design options through cycles of graphical revision and editing.
- Above all else show the data.
- Maximize the data-ink ratio.
- Erase non-data-ink.
- Erase redundant data-ink.
- Revise and edit.
Chartjunk
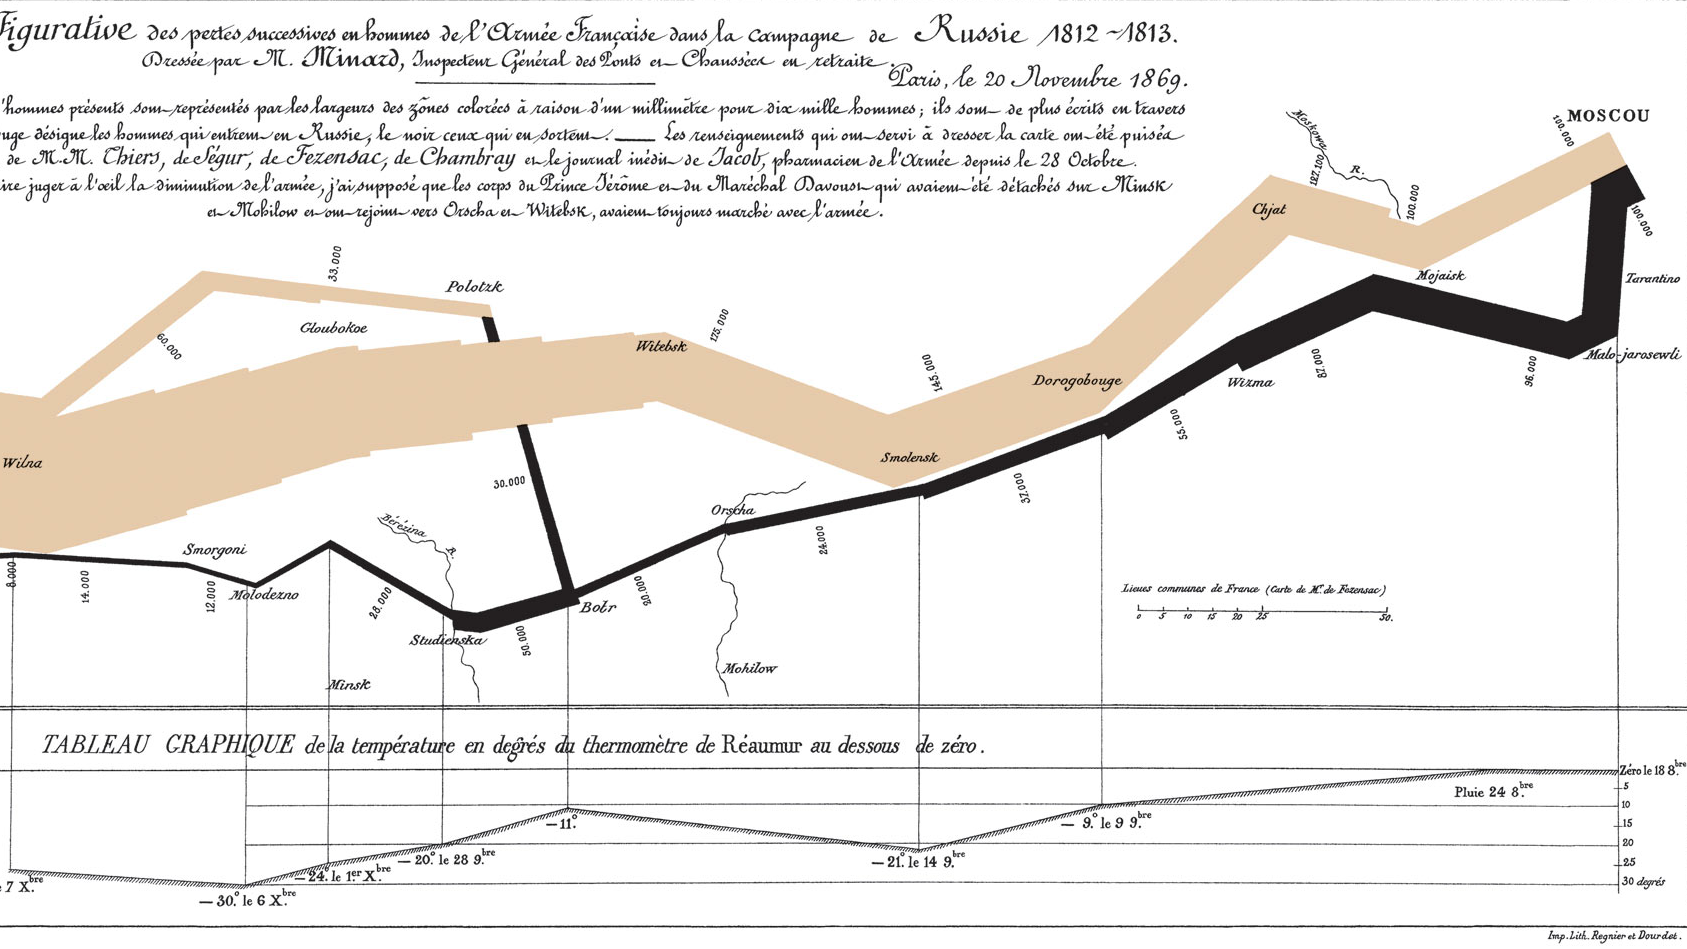
Chartunk does not achieve the goals of its propagators. The overwhelming fact of data graphics is that they stand or fall on their content, gracefully displayed. Graphics do not become attractive and interesting through the addition of ornamental hatching and false perspective to a. few bars. Chartjunk can turn bores into disasters, but it can never rescue a thin data set. The best designs (for example, Minard on Napoleon in Russia, Marey’s graphical train schedule, the cancer maps, the Times weather history of New York City, the chronicle of the annual adventures of the Japanese beetle, the new view of the galaxies) are intriguing and curiosity-provoking, drawing the viewer into the wonder of the data, sometimes by narrative power, sometimes by immense detail, and sometimes by elegant presentation of simple but interesting data. But no information, no sense of discovery, no wonder, no substance is generated by charjunk.
- Forgo chartjunk, including moire vibration, the grid, and the duck.
Data density and small multiples
High density is usually achieved on maps. Kilobytes of information per square centimeter.
Well-designed small multiples are
- inevitably comparative
- deftly multivariate
- shrunken, high-density graphics
- usually based on a large data matrix
- drawn almost entirely with data-ink
- efficient in interpretation
- often narrative in content, showing shifts in the relationship between variables as the index: variable changes (thereby revealing interaction or multiplicative effects).
Small multiples reflect much of the theory of data graphics:
- For non-data-ink, less is more.
- For data-ink, less is a bore.
Aesthetics and technique
- Aesthetics is for the artist like ornithology is for the birds.
- Given their low data-density and failure to order numbers along a visual dimension, pie charts should never be used. Better use tables sorted by numbers.
- The principle of data /text integration is “Data graphics are paragraphs about data andshould be treated as such”.
- Use golden rule for width/height it’s 1.61.